DEMO – preview of the 11 November site
Market insights

Europe's reuse and refill market.

The findings of the European Reuse Barometer organised by theme: market development, economic performance, operational performance, environmental performance, barriers and enabling conditions. Every figure names its edition and the number of companies answering; click a chart to enlarge it. The 2026 figures follow the report text of 13 October 2026 and may still change until the publication on 11 November 2026.

📈
Reuse theme 1 of 5

Market development and maturity

Where is reuse growing, which segments are developing, how do the countries differ?

130
companies answered the 2026 survey, after 115 in 2025 and 90 in 2024; 268 distinct companies across the three editions
European Reuse Barometer 2026, 4.1 Methodological approach
76 of 130
headquarters are in France, Belgium and Germany (about 58%)
European Reuse Barometer 2026, Figure 1
77%
of the 113 companies answering are at scale-up or in-market stage (SRL 8–9); 62% are fully in market
European Reuse Barometer 2026, Figure 4
77%
of the 121 companies reporting a founding year were created from 2015 onward; 18 were founded before 2000
European Reuse Barometer 2026, Figure 3

Figure 1 – Headquarters & countries of operation

Figure 1 – Headquarters & countries of operation

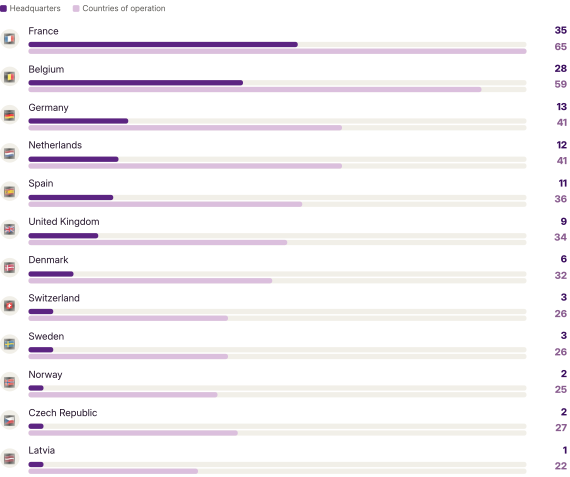
Distribution of companies operating by location of their headquarters and countries of operation (sample: all respondents surveyed in 2026)

Sample: 130 companies surveyed in 2026 · European Reuse Barometer 2026

  • The countries-of-operation count exceeds the countries’ headquarters count – France 65 vs 35, Belgium 59 vs 28, Germany 41 vs 13 – showing that reuse operators typically serve markets well beyond their home base rather than staying purely domestic.
  • Participation across Central and Eastern Europe remains limited and uneven: the Czech Republic, Slovenia, Croatia and Lithuania each account for around 1% of respondents.

Figure 2 – PPWR categories

Figure 2 – PPWR categories

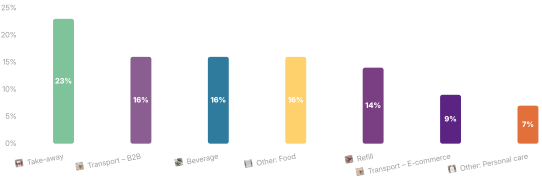
Companies distributed by their PPWR category.

Sample: 119 companies surveyed in 2026 · European Reuse Barometer 2026

  • Transport (24% across its two sub-groups) and Take-away (23%) are the two largest PPWR categories under which the respondents fall, ahead of Beverage and Other: Food (16% each) and Refill (14%); Personal care is the smallest at 7%.
  • In the two previous editions, retail was one of the main sectors among respondents. It still is this year, but that group is now split across PPWR categories: Beverage, Other: Food and Other: Personal care.

Figure 3 – Year of creation – Reuse vs Refill

Figure 3 – Year of creation – Reuse vs Refill

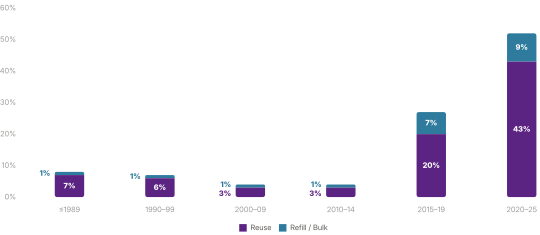
Distribution of companies by year of creation, grouped by system type (Reuse vs Refill/Bulk)

Sample: 121 companies surveyed in 2026 · European Reuse Barometer 2026

  • The respondents remain young: of the 121 companies reporting a founding year, 77% were created from 2015 onward (93 companies) and 50% since 2020 (60).
  • 18 companies were founded before 2000, including 10 before 1990, almost all of them reuse operators with long-standing industrial or deposit-return roots: this edition deliberately extended the mapping to long-established transport packaging operators.

Figure 4 – Social Readiness Level (SRL) – Reuse vs Refill

Figure 4 – Social Readiness Level (SRL) – Reuse vs Refill

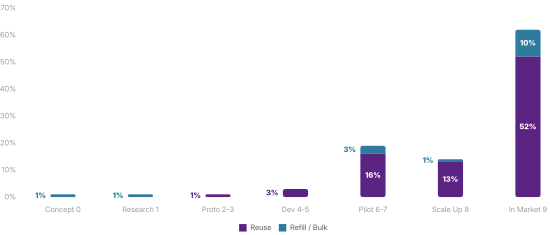
Distribution of companies by Social Readiness Level, grouped by system type (Reuse vs Refill/Bulk)

Sample: 113 companies surveyed in 2026 · European Reuse Barometer 2026

  • Most solutions remain operationally mature rather than experimental: 77% sit at SRL 8–9 (Scale-up / In-market) and 62% are fully in-market (SRL 9), consistent with the Barometer's focus on operational data rather than early experimentation.
  • The share at the two top levels has eased slightly across editions (77% in 2026, 82% in 2025, 85% in 2024) as a growing pilot-stage group enters the sample: SRL 6–7 projects rose from 6 in 2024 to 13 in 2025 and 20 in 2026.

Belgium 2026

59 of the 130 respondents to the 2026 European survey operate in Belgium. The Belgian report studies 48 of them (33 in reuse, 17 in bulk, 2 in both) and reads the 11 pan-European transport poolers separately.

With 28 companies headquartered in the country, Belgium has the second-largest national cohort in the survey, after France.

Belgian Reuse Barometer 2026 (PDF) →
💶
Reuse theme 2 of 5

Economic performance

Costs compared with single-use, revenue, profitability, employment.

65%
of the companies pay more to buy or rent reusable packaging than single-use; 15% pay the same and 20% pay less (53 companies answering)
European Reuse Barometer 2026, Executive Summary and Figure 13
58%
of the 33 companies that pay more and report their shelf price do not pass the cost on to the consumer (19 of 33)
European Reuse Barometer 2026, Figure 13 commentary
22%
of the 64 reuse companies reporting their revenue are above €10 million, against 13% in the 2025 edition
European Reuse Barometer 2026, Figure 18 commentary
95%
of the 56 reuse companies answering plan recruitments within two years, roughly 690 jobs between them
European Reuse Barometer 2026, Figure 7 commentary

Figure 13 – Reuse, Cost for the company vs for the consumer

Figure 13 – Reuse, Cost for the company vs for the consumer

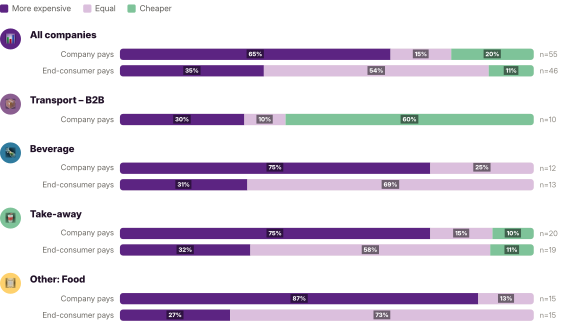
Cost of reusable packaging versus its single-use equivalent, seen from two ends: the top bar of each pair is what the company pays to buy or rent the packaging; the bottom bar is what the end consumer pays at the shelf for the product inside it. Transport appears here only as its business-to-business “Transport – B2B” sub-group – pure transport packaging with no final consumer, so it shows a “Company pays” bar only. “More expensive” = the reusable option costs more than the single-use one; “cheaper” = it costs less. Shown as % of each group's own respondents. The Transport – E-commerce sub-group (8 answers, business-to-business acquisition only) and the Other: Personal care category (5) are not shown, as too small to be representative.

Sample: 53 companies surveyed in 2026 · European Reuse Barometer 2026

  • The top bar shows what a company pays to use reusable packaging: 65% say the reusable option currently costs more than single-use, rising to 87% in Food. The bottom bar, what the consumer pays at the shelf: only 35% is more expensive, while 54% is equal and 11% is cheaper.
  • Of the 33 companies that pay more and also report their shelf price, 19 (58%) do not pass this cost on – they sell to the consumer at an equal or lower price, absorbing the premium themselves.
  • In business-to-business transport, 6 of the 10 companies answering report that buying or renting reusable packaging is cheaper than using equivalent single-use packaging.

Figure 18 – Reuse, Annual revenue

Figure 18 – Reuse, Annual revenue

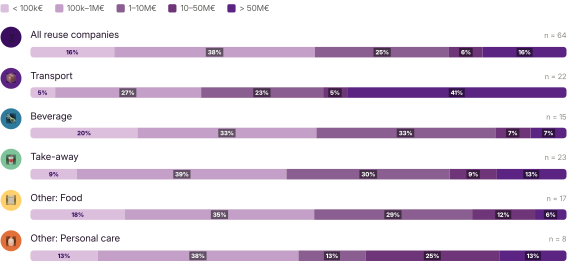
Distribution of companies by revenue bracket from reuse activities in 2025, by PPWR reuse category, shown as % of each category's own respondents (a company can appear in more than one category)

Sample: 64 companies surveyed in 2026 · European Reuse Barometer 2026

  • Across all reuse companies, revenue clusters in the €100k–€1M band (38%) and the €1–€10M band (25%). Transport is the exception: many small firms and a distinct set of large poolers, 9 of its 22 respondents reporting more than €50M.
  • Against 2025 the sample has shifted markedly larger: micro companies (under €100k) fell from 28% to 16% while those above €10M rose from 13% to 22%.
  • Companies whose main activity is reuse system management, software management, cleaning and reconditioning, or collection infrastructure were asked whether their reuse activity made a positive operating margin in 2025, before large R&D or capital investments. 12 answered: 5 said yes, 6 no, and 1 that it was too early to tell.

Figure 7 – Reuse, Planned recruitments

Figure 7 – Reuse, Planned recruitments

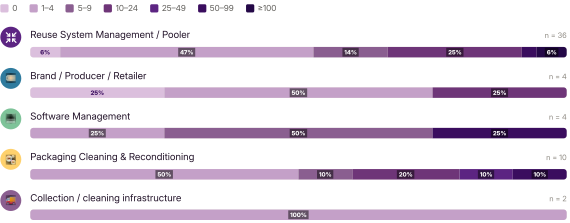
Distribution of companies by number of FTE recruitments planned within 2 years, shown as % of each main activity's own respondents (reuse companies)

Sample: 56 companies surveyed in 2026 · European Reuse Barometer 2026

  • 95% of the 56 reuse companies plan to take on new staff within two years, and only 5% plan none. For most companies, the increase is modest, often one to four new employees, while a small group plans substantially more: 11% plan 25 recruitments or more, and two companies plan 100 or more.
  • Added together, these 56 companies expect to create roughly 690 new reuse jobs within two years. Scaled by this report across the roughly 630 companies now mapped in Europe (see methodology), that points to somewhere in the region of 5,500 to 7,500 new jobs over two years, the lower figure leaving out the two companies that plan 100 recruitments or more.

Figure 6 – Reuse, Employees (FTE)

Figure 6 – Reuse, Employees (FTE)

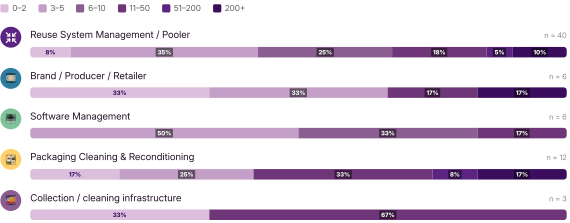
Distribution of companies by number of FTE employees working on reusable packaging, shown as % of each main activity's own respondents (reuse companies)

Sample: 67 companies surveyed in 2026 · European Reuse Barometer 2026

  • Reuse teams are still lean: across the 67 reuse companies shown, the median company employs 6 people on reuse, and 60% have between 1 and 10 FTE (one in ten has two or fewer) – consistent with the young, structuring-phase profile of figure 3. A smaller group of large employers sits alongside them: 15% have more than 50 FTE and 10% more than 200.

Belgium 2026

Nine of the 15 companies answering pay more to acquire reusable packaging than its single-use equivalent, yet only 5 of 13 charge the end-consumer more.

The operators carry this on lean teams – a median of 5.5 full-time equivalents dedicated to reuse – and they are nonetheless hiring: 16 of the 18 companies answering plan to recruit within two years, around 84 positions between them.

Belgian Reuse Barometer 2026 (PDF) →
🔁
Reuse theme 3 of 5

Operational performance

Return rates, return mechanisms, number of uses, washing capacity, tracking and system types.

73%
of Transport – B2B companies report a return rate above 95% (8 of 11)
European Reuse Barometer 2026, Figure 14 and Executive Summary
70%
of the 42 companies answering track their packaging with QR codes; roughly half use RFID
European Reuse Barometer 2026, Figure 16 commentary
17 of 33
cleaning operations run at 45% of their maximum capacity or below; the median maximum throughput is 3 million units a year
European Reuse Barometer 2026, Figure 17 commentary
1.4
median number of trips for cardboard crates, against about 50 for plastic cups (72 companies answering)
European Reuse Barometer 2026, Figure 11 commentary

Figure 14 – Reuse, Return rates

Figure 14 – Reuse, Return rates

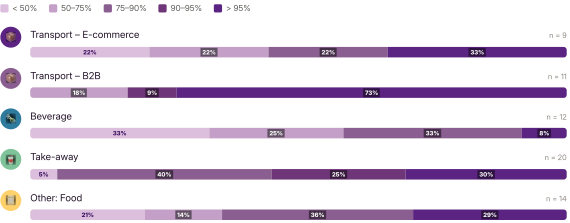
Reported return rates for reusable packaging, shown as % of each PPWR reuse category's own respondents. Transport is split into E-commerce and B2B, as elsewhere in the report; groups with fewer than six respondents (Other: Personal care) are omitted as too small to be representative. Figure 15 then breaks the same return rates down by return mechanism.

Sample: 54 companies surveyed in 2026 · European Reuse Barometer 2026

  • Return rates measure whether packaging actually comes back – the foundation any reuse system stands on. In business-to-business Transport recovery is near-total – 73% of Transport – B2B companies report a return rate above 95% – because the packaging moves inside a contracted network.
  • Consumer-facing categories are more varied but not far behind when the system is built for it: Take-away already reaches more than 90% for 55% of companies, and Other: Food tops 95% for 29%.

Figure 15 – Reuse, Return rates by return mechanism

Figure 15 – Reuse, Return rates by return mechanism

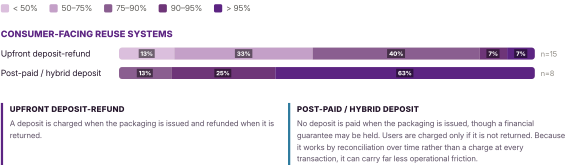
The same return rates as figure 14, regrouped by how a company secures its returns, shown as % within each bar. Only consumer-facing systems appear: business-to-business Transport recovers its packaging through contractual agreement rather than a consumer deposit, so it has no deposit mechanism to group by, and its return rates are shown in figure 14. Transport – E-commerce is counted here, since the parcel reaches a final consumer. Bars are split by deposit type: “post-paid” = charged only if the packaging is not returned (penalty-based); “hybrid” combines that with a deposit-refund. Consumer systems that report no formal deposit are a third route, not shown as a bar. Small sample: the consumer post-paid/hybrid bar rests on 8 companies – read as directional.

Sample: 23 companies surveyed in 2026 · European Reuse Barometer 2026

  • Among the 15 consumer-facing companies using an upfront deposit-refund, 1 reports a return rate above 95% and 2 above 90%. Among the 8 using a post-paid or hybrid deposit – where the customer is charged only if the packaging is not returned – 5 report above 95% and 7 above 90%.
  • The results suggest that the return rate mechanism should be adapted to the context rather than applied uniformly: a contractual arrangement in B2B, an appropriate and ideally frictionless deposit for consumers, supported by legislation and consumer education.

Figure 17 – Reuse, Cleaning capacity used

Figure 17 – Reuse, Cleaning capacity used

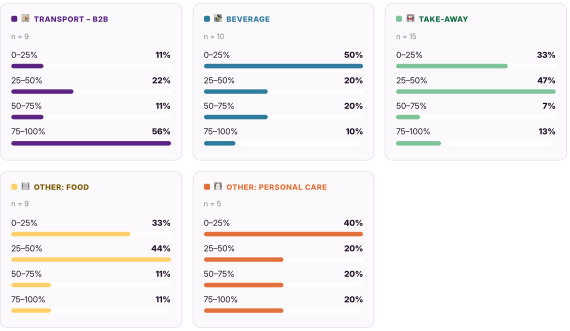
Distribution of companies by cleaning centre utilisation-rate band (0–25% / 25–50% / 50–75% / 75–100% of maximum capacity currently used), by PPWR reuse category. A company can appear in more than one category.

Sample: 32 companies surveyed in 2026 · European Reuse Barometer 2026

  • The cleaning operations surveyed continue to run below capacity. About half (17 of 33) operate at 45% of their maximum or below.
  • That idle time sits on top of substantial installed capacity: reported maximum throughput has a median of 3 million units a year, two-thirds of washers can clean at least 1 million, and the largest industrial poolers reach 200–500 million a year.
  • The constraint is therefore under-used rather than absent infrastructure: existing plants could absorb significant growth before new investment is required.

Figure 11 – Reuse, Number of cycles

Figure 11 – Reuse, Number of cycles

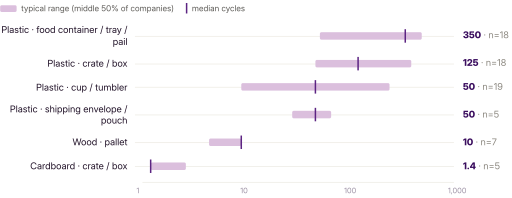
Reported reuse cycles by packaging format & material. Each row shows the median (marker) and the typical range where the middle 50% of companies fall (Q1–Q3 band), on a logarithmic scale. Only combinations reported by at least five companies are shown; a handful of extreme lifetime-cumulative values are excluded from the range so it stays readable. The marker is the median, not the mid-point of the band, so it sits on an edge whenever several companies report the same figure: three of the seven wood-pallet respondents report 10 cycles, which places the median on the upper edge, while three of the five cardboard-crate respondents report the same low figure, which places it on the lower edge.

Sample: 72 companies surveyed in 2026 · European Reuse Barometer 2026

  • Reported reuse cycles show the widest spread of any figure in the survey: for the same format and material, companies report anything from a handful of trips to hundreds. Part of this reflects the difference between a packaging's theoretical design life and the cycles it actually completes in operation. Even though the survey explicitly asked for figures “based on operational figures, not theoretical assumptions”, some answers seem to be more theoretical than proven in practice. The results are therefore indicative only.
  • Plastic cups are reused around 50 times (median), while cardboard crates are barely reused (median 1.4).
  • As an external yardstick, Reusable Packaging Europe reports an average of 56 rotations over a typical 8-year asset life for reusable transport packaging, within a range of 25 to 120 (2020 data).

Figure 16 – Reuse, Tracking technologies

Figure 16 – Reuse, Tracking technologies

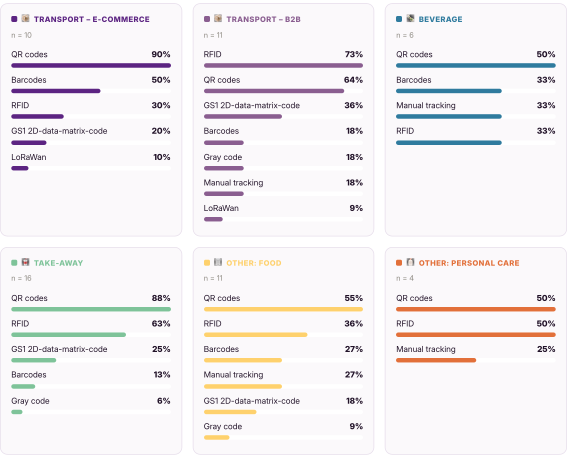
Adoption rate of tracking technologies for reusable packaging, ranked largest to smallest and shown as % of each PPWR reuse category's own respondents. A company can appear in more than one category. Small panels: Personal care rests on 4 companies and Beverage on 6, and the figure covers only the 42 respondents whose activity includes software management – read the smaller panels as directional.

Sample: 42 companies surveyed in 2026 · European Reuse Barometer 2026

  • QR codes are the default tracker in every category, from 50% in Beverage and Personal care up to 90% in Transport – E-commerce. Transport – B2B is the only category where RFID (73%) outranks QR (64%).
  • Against the 2025 edition the ranking holds but shifts up: QR stays on top (about 70% of respondents, vs 74%), RFID climbs to roughly half (from 41%), and the sharpest jump is GS1 2D data-matrix codes, from 3% to about 17%.

Figure 8 – Reuse, Type of system

Figure 8 – Reuse, Type of system

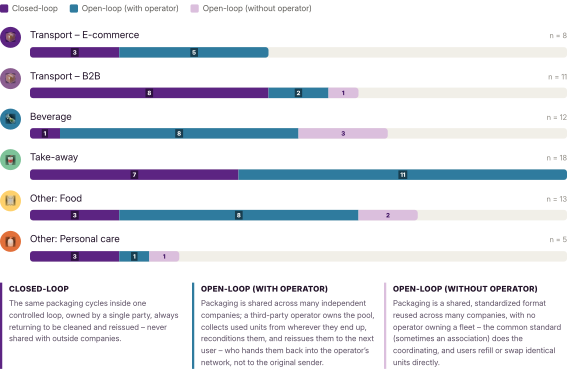
Type of reuse system operated (closed-loop / open-loop with system operator / open-loop without system operator), by PPWR reuse category – bar length is proportional to the number of respondents in that category and each segment is labelled with the number of companies (a company can appear in more than one category)

Sample: 51 companies surveyed in 2026 · European Reuse Barometer 2026

  • Of the 52 companies answering, 26 report an open-loop system with a system operator (50%), 22 a closed-loop system (42%) and 4 an open-loop system without operator (8%). In Transport – B2B, 8 of 11 report a closed loop.
Across editions. Washing capacity is the one indicator of this theme that can be compared between 2025 and 2026, and only roughly, because the two surveys used different answer bands. In 2025, 70% of the 39 companies answering used less than half of their washing capacity (between 2% and 45%). In 2026, about half of the 33 companies answering used 45% or less. Tracking technologies compare one by one: QR codes were used by about 70% of the companies answering in 2026 against 74% in 2025, RFID by roughly half against 41%, GS1 codes by about 17% against 3%.
🌍
Reuse theme 4 of 5

Environmental performance

The evidence on environmental benefits and the conditions behind it.

54%
of the 95 companies answering hold a life cycle assessment of their reuse model (51); 13 made it publicly available
European Reuse Barometer 2026, Figure 20
48% · 42%
held a life cycle assessment in 2024 (21 answering) and in 2025 (107 answering)
European Reuse Barometer 2026, Figure 20
46–80%
theoretical CO2 reduction compared with single-use, reported by three of these assessments (RE-ZIP, DW Reusables and Le Fourgon), depending on the number of uses
European Reuse Barometer 2026, Executive Summary and bibliography entries 37–39
18
life cycle assessments can be read on this site: 13 published studies and 5 sets of findings shared by companies of the 2025 and 2026 editions
This website, Cases, LCAs & library

Figure 20 – Life Cycle Assessments – 2024 · 2025 · 2026

Figure 20 – Life Cycle Assessments – 2024 · 2025 · 2026

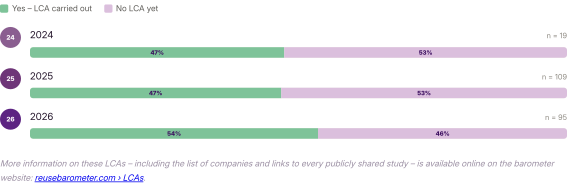
Share of companies that have carried out a Life Cycle Assessment (LCA), compared across the 2024, 2025 and 2026 editions. Sample sizes differ strongly between editions (21, 107 and 95 respondents), so read the comparison as directional.

Sample: 21 companies (2024) · 107 companies (2025) · 95 companies (2026) · European Reuse Barometer 2026

  • Just over half of this year's respondents (54%, 51 of 95) report having carried out a Life Cycle Assessment dedicated to their reuse model. The share has held broadly steady across the three editions – 48% in 2024, 42% in 2025.
  • ADEME’s environmental assessment of deposit-based reuse for glass packaging – fourteen reuse scenarios modelled against single-use, testing return rates, packaging weight, transport distances and recycling rates – is cited across the French reuse sector and has guided how operators there design their systems.
  • A published LCA can turn one company’s modelling into a design rule the whole industry can build on.
Across editions. The share of companies with a life cycle assessment is compared across 2024, 2025 and 2026 on bases of 21, 107 and 95 companies; the report reads the comparison as directional. Environmental results (carbon reductions, break-even points) are company or study figures, never survey aggregates: they are listed with their source in the case studies, the LCAs and the library.
🧭
Reuse theme 5 of 5

Barriers and enabling conditions

Policy, financing, infrastructure and collaboration: what operators ask for.

72%
of the 126 companies answering put stronger regulation, EPR schemes or enforcement limiting single-use first; technology comes last at 14%
European Reuse Barometer 2026, Figure 22
70%
of the 121 companies answering select taxes on single-use packaging where a reusable or bulk alternative exists
European Reuse Barometer 2026, Figure 23
49%
of the 113 companies answering see a clear or somewhat positive relationship with EPR organisations; 13% lack visibility on what EPR schemes do
European Reuse Barometer 2026, Figure 23
83% · 31%
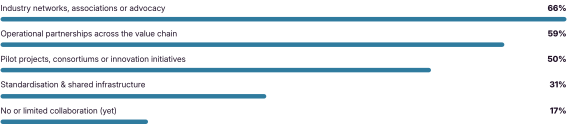
collaborate in at least one form; 31% on standardisation and shared infrastructure (120 answering)
European Reuse Barometer 2026, Figure 21

Figure 22 – Types of support needed

Figure 22 – Types of support needed

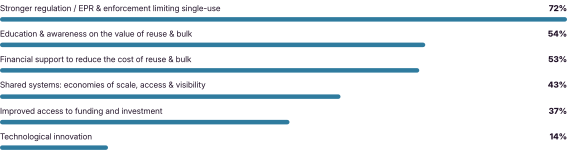
Types of support that would most benefit companies active in reusable packaging or bulk, as % of respondents (multi-select).

Sample: 126 companies surveyed in 2026 · European Reuse Barometer 2026

  • The hierarchy of needs is unambiguous, and it is the same one as last year, with a stronger margin.
  • Education and awareness (54%) and financial support to close the cost gap (54%) form the second tier; shared systems for economies of scale (43%) and access to funding (37%) follow.
  • Technological innovation ranks last at 14%: for the second edition running, companies do not identify technology as the main constraint.

Figure 23 – EPR schemes & policy measures

Figure 23 – EPR schemes & policy measures

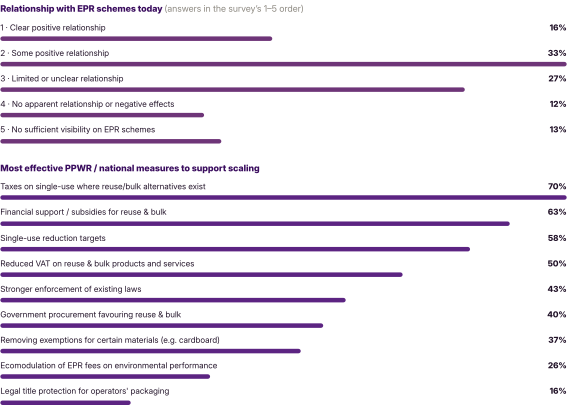
Top: how companies describe the relationship between EPR schemes and their reusable packaging or bulk activities (single answer on the survey’s 1–5 scale, % of 112 respondents). Bottom: the EU (PPWR) or national measures companies consider would most effectively support scaling (multi-select, % of 120 respondents).

Sample: 113 companies (EPR relationship) · 121 companies (measures), surveyed in 2026 · European Reuse Barometer 2026

  • 49% of the 113 companies answering see a clear or somewhat positive relationship with Extended Producer Responsibility (EPR) organisations, but a full half do not – 27% find it limited or unclear, 11% see no relationship or negative effects, and 13% lack visibility on what EPR schemes even do.
  • Asked which measures would most effectively support scaling, the 121 companies answering select: taxes on single-use where a reusable or bulk alternative exists (70%), subsidies for reuse and bulk (63%), single-use reduction targets (58%) and reduced VAT on reuse and bulk (51%) lead, ahead of enforcement (43%), green public procurement (39%) and removing material exemptions such as cardboard (37%).
  • Asked in their own words what EPR schemes should change, 52 companies answered. They converge on a single demand: that EPR stop functioning mainly as a recycling-financing mechanism and start paying for prevention.

Figure 21 – Industry collaboration

Figure 21 – Industry collaboration

Forms of collaboration companies take part in, as % of respondents (multi-select).

Sample: 120 companies surveyed in 2026 · European Reuse Barometer 2026

  • This year’s structured question confirms the level – 83% collaborate in at least one form, only 17% report little or none yet – and reveals the shape: two-thirds (66%) take part in industry networks and advocacy, 59% run operational partnerships across the value chain and half are in pilot projects or consortiums. The least reported form is collaboration on standardisation and shared infrastructure (31%).
Across editions. The ranking of the support asked for compares in order only (single answer in 2025, multi-select in 2026): stronger regulation and enforcement led in both editions and technology came last in both. The headline level of collaboration compares (82% in 2025 on an open question, 83% in 2026). The relationship with EPR schemes and the preferred measures are new in 2026; the ranking of barriers was last asked in 2025 (see the 2025 panel below).

Belgium 2026

Asked in this survey which policy measures would help them, 84% of companies operating in Belgium (38 out of 45) chose a tax on single-use packaging where a reusable or bulk alternative exists – the highest score of any measure in this survey.

Asked what would help them most, the two groups answer differently: 88% of reuse companies rank stronger regulation and enforcement first, while refill operators rank education and awareness first (71%).

Collaboration is already widespread – 31 of 43 report at least one active form – but standardisation, at 28%, remains the least common form.

Belgian Reuse Barometer 2026 (PDF) →
🫘
Refill

Refill, measured at European level for the first time

The 26 refill operators surveyed in 2026: activities, assortment, sourcing, losses and revenue.

26
refill companies answered the 2026 survey; 25 described their activities
European Reuse Barometer 2026, Section 8
215
bulk references: the median assortment of the 18 companies reporting it; more than a quarter carry more than 500
European Reuse Barometer 2026, 8.1
70% · 80%
median share of the product range sold in bulk (18 answers); median share of revenue from bulk (14 answers)
European Reuse Barometer 2026, 8.1 and 8.3
12 of 15
companies reporting a distance sell local products that travel less than 150 km; 12 of 13 report losses of 5% or less
European Reuse Barometer 2026, 8.2

Figure 19 – Refill, Companies’ activities

Figure 19 – Refill, Companies’ activities

Refill activities provided by the bulk operators surveyed, as % of refill respondents (multi-select).

Sample: 25 Refill companies surveyed in 2026 · European Reuse Barometer 2026

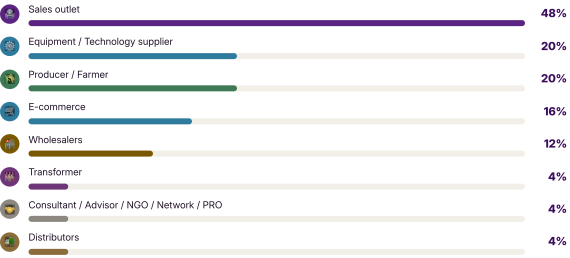
  • Of the 25 refill operators describing their activities, 48% tick sales outlets, 20% producer or farmer, 20% equipment or technology supplier and 16% e-commerce.
  • Bulk represents a median 70% of their product range, and three-quarters of them dedicate at least half their assortment to it.
  • Among the 14 operators reporting it, the median share of revenue generated by bulk is 80%, and 11 draw more than half their turnover from it. 58% (11 of 19) report that the share of bulk in their model is increasing, and 84% report it stable or growing.
  • The obstacles cited by refill operators lie at both ends of their chain rather than in consumer demand.
Across editions. Refill is measured at European level for the first time in 2026, so no European comparison exists yet. The Belgian editions of 2025 and 2026 measured it twice; the Belgian report recomputed its 2025 series on the 2026 basis and notes that 33 companies answered the refill questions in 2025 against 17 in 2026.

Belgium 2026

Bulk retail is an established activity for the 17 operators studied rather than a side activity. A median 70% of their assortment is sold loose, bulk generates a median of 80% of their revenue, and ten of the seventeen report that this share is still growing.

The main obstacle they name lies with their suppliers rather than with customers: half of the operators answering are held back by suppliers that are hard to find or not delivering in bulk, while low consumer demand is named by one in ten.

Belgian Reuse Barometer 2026 (PDF) →
Go further

Method, definitions and reports.

How the figures are collected and checked →
All European and national reports →
A figure looks wrong? Write to us.